How many reps at 80% of 1RM, and why the number you are using might be wrong
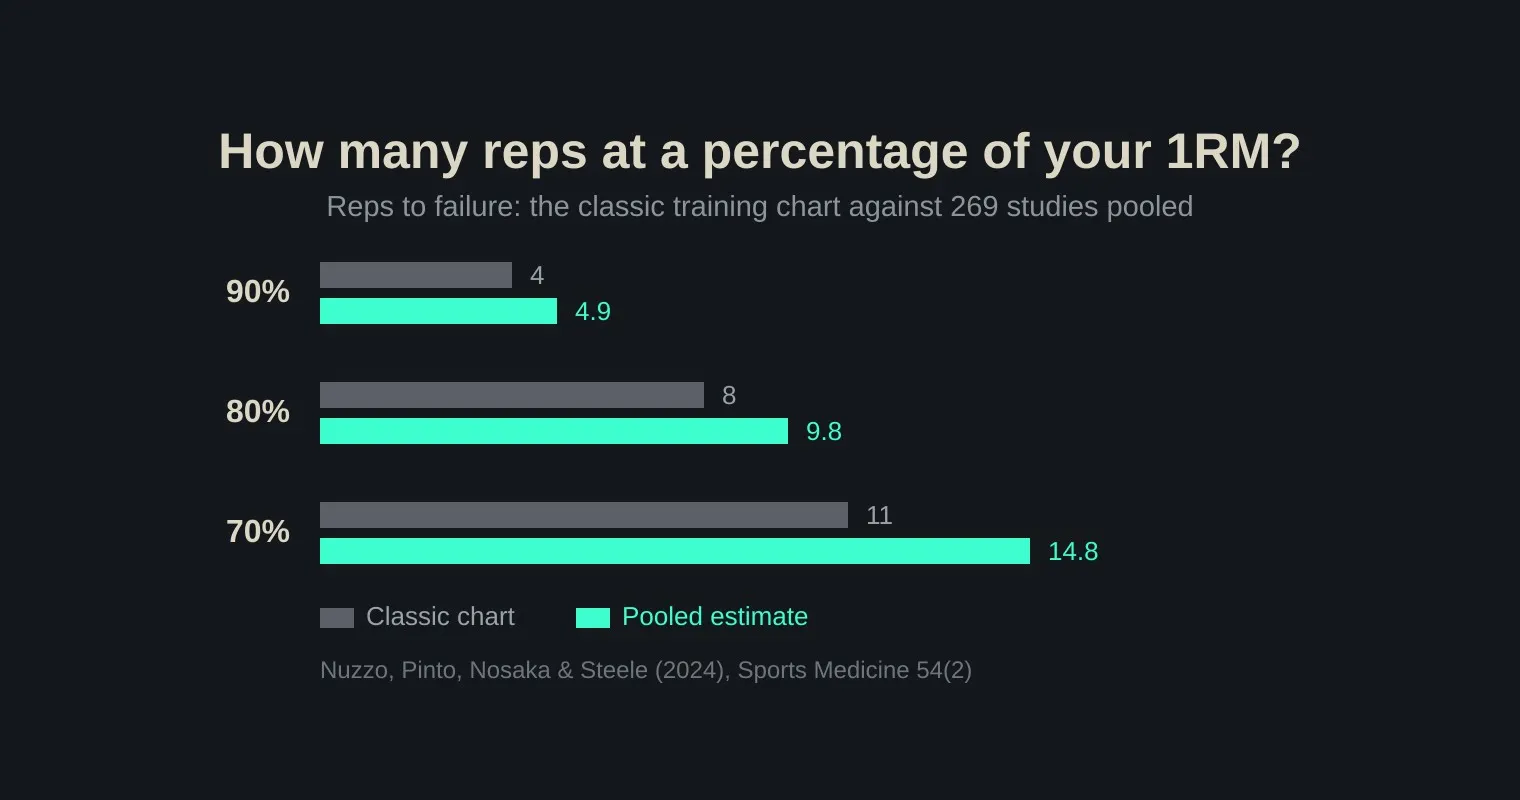
If your program is written in percentages — five sets of three at 85%, three sets of eight at 80% — then somewhere behind it is a table saying how many reps a given percentage should allow. Ask it how many reps at 80% of 1RM and it says eight. Eleven at 70%. Four at 90%. It has been printed in strength and conditioning textbooks for decades.
It is a reasonable table, built on a handful of studies, the main two from 1987 and 1990, and it gives a single number with no sense of how far off it might be for you. A meta-regression in Sports Medicine has now checked it against 269 studies: the pooled average at 80% was 9.75 reps, not eight. The more useful part is the number the old table never had — how much lifters differ from each other around that average.
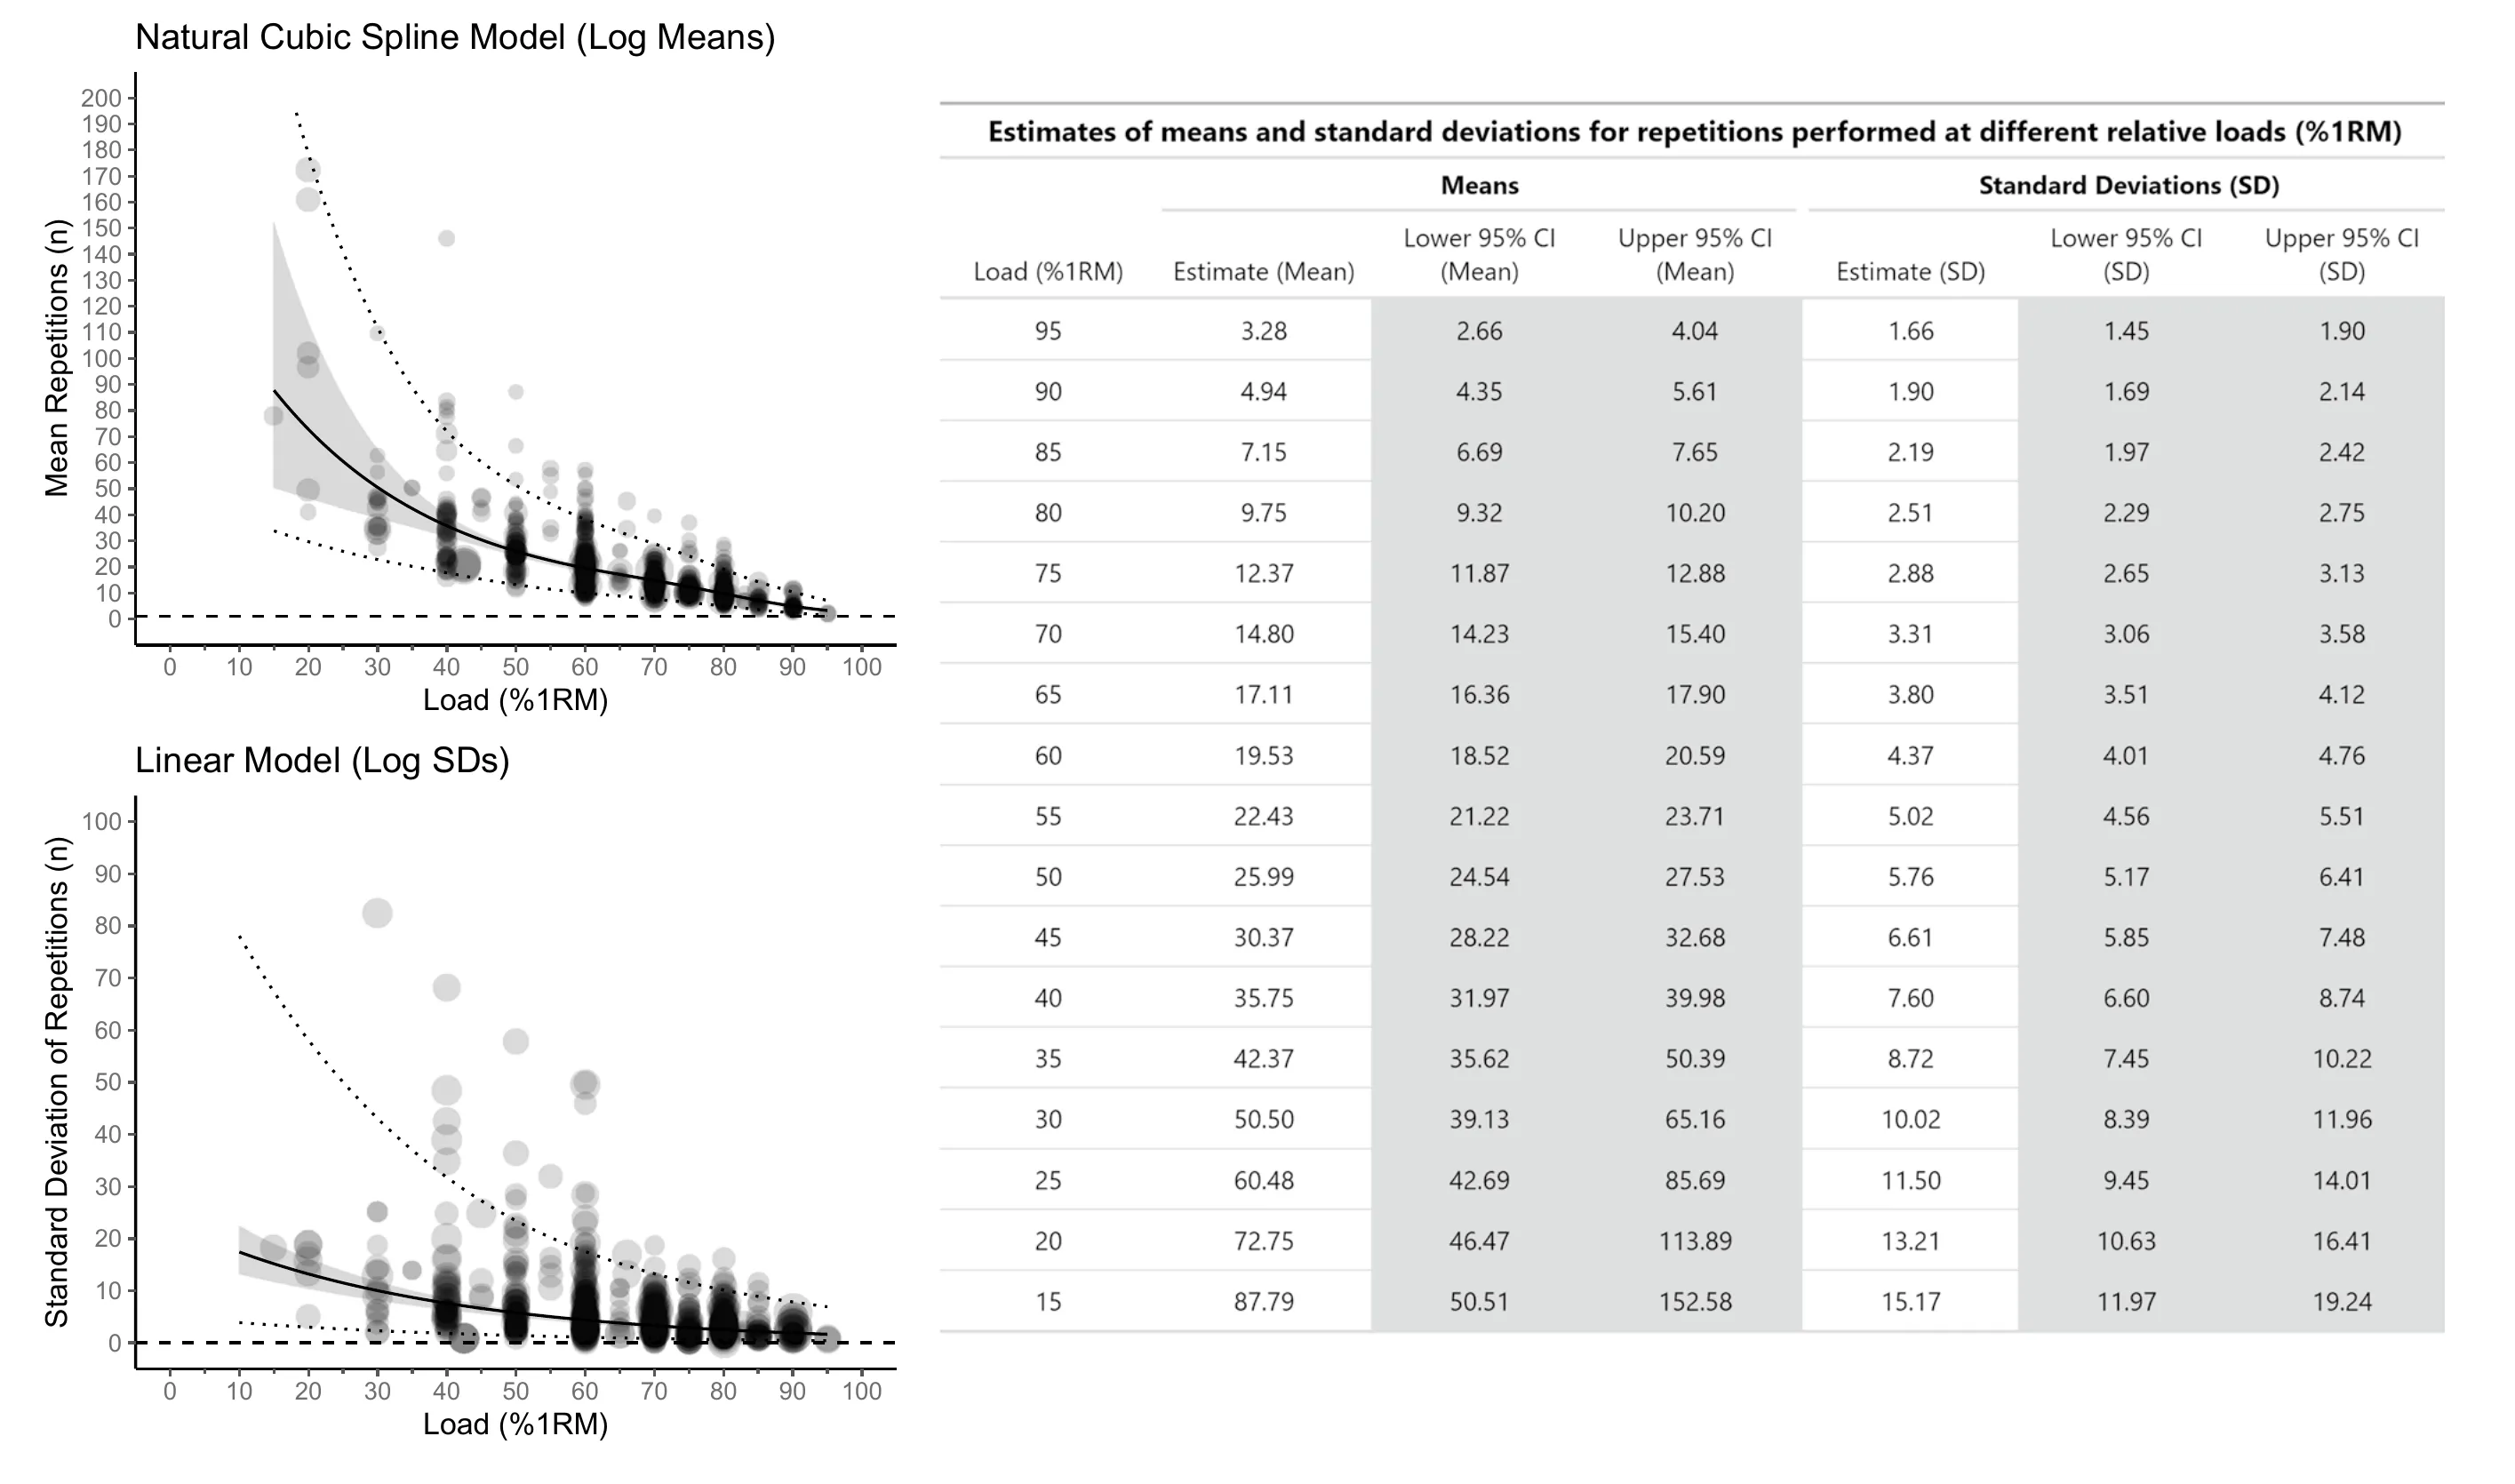
Figure 2 from Nuzzo and colleagues (2024), reproduced under CC BY 4.0. Each bubble is one group from one study, sized by how much it counts. The table on the right is the updated rep chart: mean reps in the left block, the between-lifter standard deviation in the right block.
Table of Contents
- How many reps at 80% of 1RM, and why the number you are using might be wrong
- Where the old rep chart came from
- How many reps at 80% of 1RM across 269 studies
- The average is precise. You are not the average
- Reps at 80% of 1RM are not the same on the bench as on the leg press
- Where this sits in the wider evidence
- What this means if you train on percentages
- The limits of this evidence
- Common Questions About Reps and 1RM Percentages
- How Pick It Up Helps
- Further Reading & References
Where the old rep chart came from
The chart most programs inherit runs from 100% of your one-rep max down to about 65%, printed in Essentials of Strength Training and Conditioning, the National Strength and Conditioning Association’s textbook — which the paper describes as commonly assigned. It was presented as a general guideline built from a small number of studies, two papers by Hoeger and colleagues in 1987 and 1990 named as the examples, with one number per load and no indication of how much lifters vary around it.
James Nuzzo and colleagues rebuilt it from the whole published record, collecting every repetitions-to-failure test they could find in which a 1RM had been measured rather than estimated, the test done fresh rather than mid-workout, and the result reported with a measure of spread. That came to 952 tests by 7,289 people across 269 studies, from 1961 to 2023; after dropping tests that could not be pooled, the analysis ran on 898 tests from 6,970 people.
How many reps at 80% of 1RM across 269 studies
About ten. The pooled estimate is 9.75 reps to failure at 80% of 1RM, with a confidence interval of 9.32 to 10.20 — the average pinned to within about half a rep.
The updated chart beside the textbook one, over the range most programs live in:
| Load | Classic chart | This analysis | Spread between lifters |
|---|---|---|---|
| 95% of 1RM | 2 | 3.3 | 1.7 |
| 90% | 4 | 4.9 | 1.9 |
| 85% | 6 | 7.2 | 2.2 |
| 80% | 8 | 9.8 | 2.5 |
| 75% | 10 | 12.4 | 2.9 |
| 70% | 11 | 14.8 | 3.3 |
| 65% | 15 | 17.1 | 3.8 |
| 60% | — | 19.5 | 4.4 |
The old chart holds up well at heavy loads and drifts at moderate ones. At 90% the difference between 4 and 4.9 reps is not worth restructuring over. At 70% the difference between 11 and 14.8 is nearly four reps — a set taken to the edge against a set with about a quarter of its work left.
The drift runs in one direction. Everywhere the two disagree, the pooled estimate is higher. If you have ever hit a prescribed 8 at 80% and thought I had more than that, the data says you probably did.
The average is precise. You are not the average
The last column is what the old chart could never give you. Alongside the mean, the authors modelled the standard deviation between individuals — roughly, how far a typical person lands from the average. At 80% of 1RM it is 2.51 reps, at 70% 3.31, at 60% 4.37.
Next to the confidence interval on the average, that is the shape of it: the average at 80% is nailed to half a rep, and people are scattered around it by two and a half. One standard deviation either side of 9.75 runs from about 7 to about 12 reps. Two lifters with identical, properly tested 1RMs can sit at opposite ends, and neither is doing anything wrong.
The spread widens as the load gets lighter — 1.7 reps at 95%, 4.4 at 60%. Heavy loads are self-limiting: at 95% of your max there is not room for much variation. The lighter the load, the more room for whatever makes one person’s muscular endurance differ from another’s, and the less a table can tell you about yourself.
The authors are careful about how much of that spread is real: some is a statistical artefact, since deviations grow with the averages they sit around, and some could be measurement error that scales with the count. They make the practical point anyway — the spread illustrates how much variation to expect, whatever its source.
The obvious candidates do not explain the spread. Comparing all-male with all-female groups, the relationship looked much the same; modelled across age and read out at 30, 50 and 70 years, much the same again; and groups with prior resistance training experience did not clearly differ from groups without. Did not clearly differ is the phrase to hold on to: the point estimates were not identical, and the uncertainty around them was wide enough that the comparisons could not rule out no difference — a statement about the precision of the evidence as much as about the world. The authors saw no case for separate charts for men, women, older lifters or beginners, and if you expect your own rep capacity to be unusual after ten years of lifting, this analysis offers no support and cannot rule it out either.
Reps at 80% of 1RM are not the same on the bench as on the leg press
The one moderator that produced a clear signal was the exercise. There were enough data on the bench press and the leg press to model each separately:
| Load | Bench press | Leg press |
|---|---|---|
| 90% of 1RM | 4.1 | 8.7 |
| 85% | 6.2 | 10.7 |
| 80% | 8.8 | 13.1 |
| 75% | 11.5 | 15.8 |
| 70% | 14.1 | 19.0 |
| 65% | 16.6 | 22.6 |
Those gaps are the whole reason a single chart is a blunt instrument.
So a program prescribing “3×8 at 80%” across a whole session is prescribing two different efforts. On the bench that is close to a hard set — the average lifter had about nine in them. On the leg press, working from the average of 13, stopping at eight leaves something like five reps unused, which by the evidence on training close to failure is far enough away to cost you growth.
These are the only two exercises with their own charts. The authors name the overhead press, lateral pulldown, seated row, triceps extension, knee flexion and calf raise as commonly prescribed lifts with minimal published data, and recommend the general chart for everything else.
Where this sits in the wider evidence
This study does not overturn anything. It is the largest attempt we have found at a question the field has been answering from two small studies for thirty years, and it points where smaller work has: the load-rep relationship is real, useful, and far too variable between people to prescribe from a table.
Athlete type moves the number a long way. Richens and Cleather put eight weightlifters and eight endurance runners through leg-press sets to failure. At 70% of 1RM the runners averaged about 40 reps and the weightlifters about 18; at 80% it was roughly 20 against 12; at 90% the two groups were no longer distinguishable. Sixteen people is an illustration rather than a measurement, but that pattern — a large gap at moderate loads closing as the load gets heavy — is the shape of the spread in the big analysis.
Some of the difference is in the muscle itself. Van Vossel and colleagues estimated muscle fibre type composition in 95 resistance-training novices and had a subset perform sets to failure. People with a slower fibre make-up did more reps at 60% and 80% of 1RM than people with a faster one, and their conclusion is that coaches should move away from traditional load-repetition tables toward individual testing.
Neither contradicts the meta-regression, which says itself that it lacked the data to analyse athlete type and cites evidence that endurance athletes manage more reps at loads at or below 75%. It gives the population average and the width of the spread; these tell you what some of it is made of.
What this means if you train on percentages
About 10 reps at 80% of 1RM, against 8 in the textbook chart, with two and a half reps of spread between lifters. What that leaves you:
- Use the chart to pick a starting load, then correct it with what you did. The table is a good first guess and a bad final answer. Load the bar at what it says should give you eight, do the set, and let the reps you got set the load next time. That loop takes one session and beats any table.
- Treat a percentage as a load, not as an effort. A percentage tells you what is on the bar; how hard the set is depends on your own rep capacity at that load. For muscle growth proximity to failure sets the stimulus, so reps in reserve is the more useful unit to program in — and how heavy you need to lift answers the load question differently for growth than for strength.
- Do not assume one rep target fits every lift in the session. The leg press ran roughly four to five reps ahead of the bench press across 70–90% of 1RM. Those are the only two lifts with enough data to compare, so treat the gap as a warning rather than a rule for every push and pull.
- Be more careful the lighter you go. Percentage prescriptions are most trustworthy where they matter most — heavy strength work — and least trustworthy in the moderate-load range where most hypertrophy — muscle growth — volume gets done.
- Sex, age and training status did not clearly move the relationship, so there is one chart for everybody rather than several.
- Calibrate to yourself. One set to failure at a known percentage tells you more about your own numbers than any table can.
The limits of this evidence
The search was deliberately not systematic. The authors list it first among their own limitations: personal files, keyword searches and citation tracking rather than a formal systematic-review protocol, which makes it hard to reproduce. What it turned up was 269 studies against the handful the old chart rested on.
The people in it are young, male-skewed, and only partly trained. Two thirds of the groups were male, the median group’s average age was 23, and 60% were resistance trained, leaving 40% who were not. A 50-year-old woman with a decade of training behind her is not well represented here, and the moderator analyses were too imprecise to say whether that matters.
The groups were small. The median group contributed 13 participants, with a range from 3 to 112. The strength of the analysis is in pooling hundreds, not in any one.
It is a chart of first sets to failure. Every test was done fresh and unfatigued, so this is not how your third set behaves and the chart should not be read as predicting it.
The rep tempo is mostly unrecorded. Fewer than half the studies reported how long a rep took; among those that did, a hint that slower reps meant fewer reps, with uncertainty covering no effect at all.
Two of the four authors previously worked for a company that designs and sells resistance exercise equipment. It is declared in the paper, and the extracted data and the analysis code are published openly.
Common Questions About Reps and 1RM Percentages
Are 1RM calculators accurate? A rep-max calculator is this relationship run backwards: you enter 10 reps at 100 kg and it hands you a 1RM. It is therefore as accurate as the chart it inverts, carrying the same two-to-three-rep spread between individuals. Fine for picking a starting weight, not for a number you are going to plan a meet around — if a number matters, test it.
How Pick It Up Helps
A percentage is a statement about the bar, and what you need is a statement about the effort. A table written for the average lifter cannot bridge that gap, and doing it by hand means testing every lift, at every load, and re-testing every time you get stronger.
That is what autoregulation is for. Pick It Up gives every set a target weight, a target rep count and a target difficulty on a simplified RPE scale, then updates the next set’s targets from what you reported on the last one. If 80% gives you twelve reps on the leg press and eight on the bench, the app finds that out from your own sets instead of assuming a number from a chart. At the end of each block it re-evaluates your 1RMs from everything you did, so the percentages it prescribes stay attached to the lifter you are now.
Start a free trial and have all the science taken care of for you, so you can get back to building a better you.
Further Reading & References
- Maximal Number of Repetitions at Percentages of the One Repetition Maximum: A Meta-Regression and Moderator Analysis of Sex, Age, Training Status, and Exercise — Nuzzo JL, Pinto MD, Nosaka K, Steele J. Sports Medicine, 2024; 54(2): 303–321. PubMed. The meta-regression this article summarises and the source of every rep estimate, confidence interval and standard deviation in it. Published open access under CC BY 4.0, which is also the licence on Figure 2 above.
- The relationship between the number of repetitions performed at given intensities is different in endurance and strength trained athletes — Richens B, Cleather DJ. Biology of Sport, 2014; 31(2): 157–161. PubMed. Cited once, for how far apart two training backgrounds can sit at the same percentage. Its abstract was read, not its full text.
- Muscle typology influences the number of repetitions to failure during resistance training — Van Vossel K, Hardeel J, Van de Casteele F, de Jager S, Lievens E, Boone J, Derave W. European Journal of Sport Science, 2023; 23(10): 2021–2030. PubMed. Cited once, for fibre type as one source of the between-lifter spread. Its abstract was read, not its full text.
- How Close to Failure Should You Train for Muscle Growth? — why the effort a set represents matters more than the load on the bar.
- How Heavy Should You Lift to Build Muscle? Load vs Strength — which percentage to put on the bar, which turns out to matter far more for strength than for growth.
- How Many Sets Per Week for Hypertrophy: Where Returns Diminish — the volume evidence, and the load range most of it gets done in.
- How to Break Through a Plateau in Weightlifting and Strength Training — what to change when a percentage-based program stops delivering.
- Training Frequency for Strength: How Many Days Per Week — how often to repeat the work once the loads are right.